After several years of most credit unions having more shares than loans, the pendulum is starting to swing the other way. How much of a decrease is discussed in a variety of forums, but the first chart from a Federal Reserve analysis sums it up.
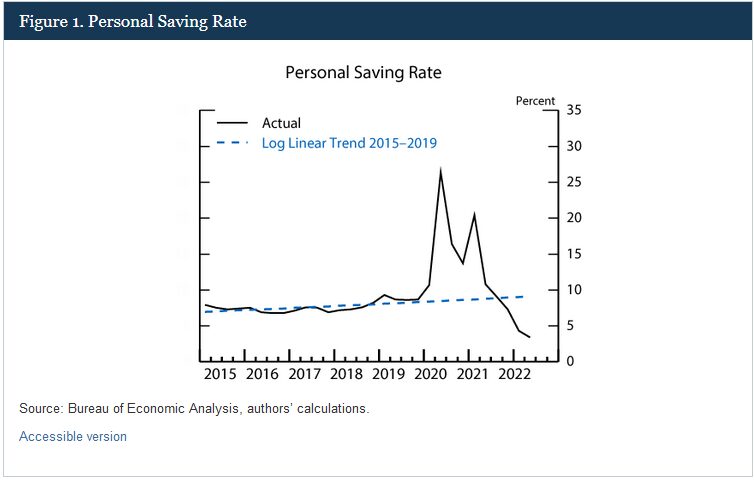
For the first time in a while, credit unions are finding themselves in a position where there is competition for their shares.
There are a variety of ways of getting an understanding of this problem. One is to make sure that each of your credit union members is at the highest retention level possible. You can find more information on that approach here.
Finding a place to start, a way to start teasing apart where you have risk in your shares is a challenge for most CUs that don’t have time to create custom reports or analyses. In this blog post, I will give an example method for breaking apart the different categories to get a quick view of your share loss risk.
Breakdown
We are going to start with some assumptions about the different share types. For instance, CD products are locked up for specific periods of time with a known close. It is rare to see a material number of CDs canceled early and removed from the CU. Because of this defined end date, we will assume that CDs are some of the least risky in terms of near-term loss.
On the opposite side of the spectrum, you have shares that have not had a transaction in the last 90 days. We will assume these shares are at a high risk as there is no indication that a member is actively interacting with this share and could move with little effort.
These two examples create the bookends for the share risk loss spectrum. While they don’t have a numerical value or probability of loss, it still gives the CU a place to identify riskier versus safer shares.
Here are some example categories in order of least risky versus most.
- CDs
- All certificates of deposit
- Investments
- IRA, Money Market, KEOGH, etc.
- Business
- Sole partnerships, LLC, Non-Profits, etc.
- 30 Day Electronic Deposit
- The share received an electronic deposit in the last 30 days
- 30 Day Cash Deposit
- Share received a cash deposit in the last 30 days
- 30 Day Transaction
- The share executed any transaction in the last 30 days
- 90 Day Transaction
- The share executed any transaction in the last 90 days
- No Transaction 90 Days
- The share has not executed a transaction in the last 90 days
Each of these categories should be mutually exclusive. For instance, you shouldn’t have a share labeled both business and no deposit in the last 90 days. It is possible you will have a business share that has not executed a transaction in the previous 90 days. But we still want to represent the share with the highest level of resistance to removal.
With these primary categories, you can do a simple KPI of the sum of the ‘90 Day Transaction’ and the ‘No Transaction in 90 Days’ and divide that by the total of your shares. This should represent your highest risk as expressed as a percent.
Here is an example of what this breakdown might look like for a CU.
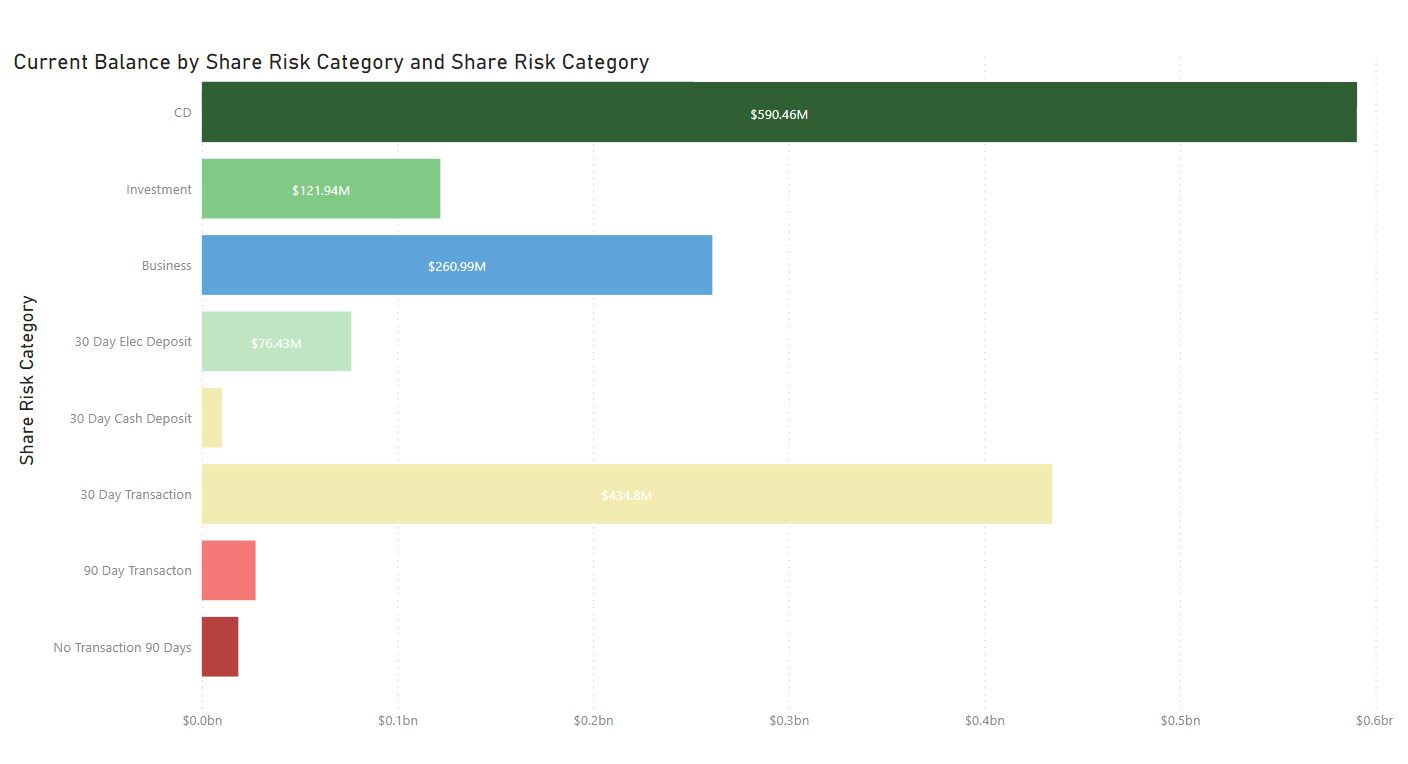
This breakdown is by no means the end of the analysis. Each of these categories can be broken down into further detail. For example, you can take the CD and break it into CDs that are from new funds and CDs that are rolled over. What CDs belong to older versus younger members and so on. The investments can be broken into different investment types and then by ones that are being actively managed, passive, and where a member has a larger relationship with the CU.
Each breakdown allows the CU to choose how to engage with that member for that share and assess which items require urgent action versus a more passive approach.
Breaking the shares out in this manner can be used both for communicating to a larger audience and the executives and is the starting point for a deeper analysis. Taking this approach should not require substantial effort to build as the share type, account type, and a handful of transaction type post dates are all that is required.
Conclusion
Knowing how to get started on looking at the amount of risk in your shares can be difficult, as there are so many different ways to look at the data. We hope that this blog has been helpful to quickly get a sense of the risk and providing you with options for further analysis and action.