When a credit union is first deploying Power BI, it can be very tempting to click on the SQL Server button and navigate to a table or put in a query to get your data.


There isn’t really anything in Power BI that will tell you if this is the right thing to do or what the downstream consequences are. While the CU is still early in its deployment, this solution will seem to work without issue. The problems really don’t surface until the deployment starts to roll out to the larger team, and the solutions get more complicated. This blog will explore why this approach creates such a significant problem later.
Direct Table Import
At first blush, being able to quickly navigate several tables and add them all at the same time seems convenient. But in most environments, the raw tables can be very large both in terms of records and columns.
Using a detailed loan table from ARCU as an example, that table will have hundreds of thousands of records for every process date and has over 600 columns. If you try and load this table ‘as is,’ millions of records will be loaded. After the load, you can filter the results to a single process date, but you will still need to load those records.
It is unlikely that any analysis would require all 600+ columns from this table. If anything, all these unneeded columns make an analysis that much more complicated as users will have to sift through all of these, looking for the most important ones. You can use the Power Query editor to remove many of these columns, but this is a slow process. More importantly, for every analysis where you need loan data, you need to repeat these steps.
Direct Query
Given the issues with trying to bring in detailed tables, many CUs will try to use SQL queries during the import process. This makes a lot of sense because it allows you to control how much data comes back in terms of rows and columns. Copying and pasting a query into multiple Power BI models doesn’t seem all that bad when compared to trying to bring in raw tables.
The problem with this approach doesn’t really show up until the CU has deployed dozens of solutions using many of the same queries for members/loans/shares, etc. Somewhere down the line, the following situation will happen. The CU will change its definition of a member, and it needs to be consistent across the organization. This now requires someone to open every report that utilizes member data and update the SQL by hand. Again, copy and paste can be used, but given the small space, it is easy to get fragments and miss sections of the update code that now create support ripples. The longer this approach is used, the larger the support issues.
Semantic Layer
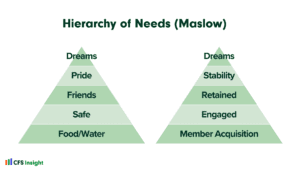
The solution to this problem is to utilize a semantic layer to abstract the raw data from the end reports. Briefly, a semantic layer is a transformation of the raw data that generally deals with merging data from multiple places, only returns the desired rows, and returns the selected columns with names better suited for consumption.
Power BI really doesn’t tell you that this layer is required. It is only after trying the alternatives that the need for this layer becomes pronounced.
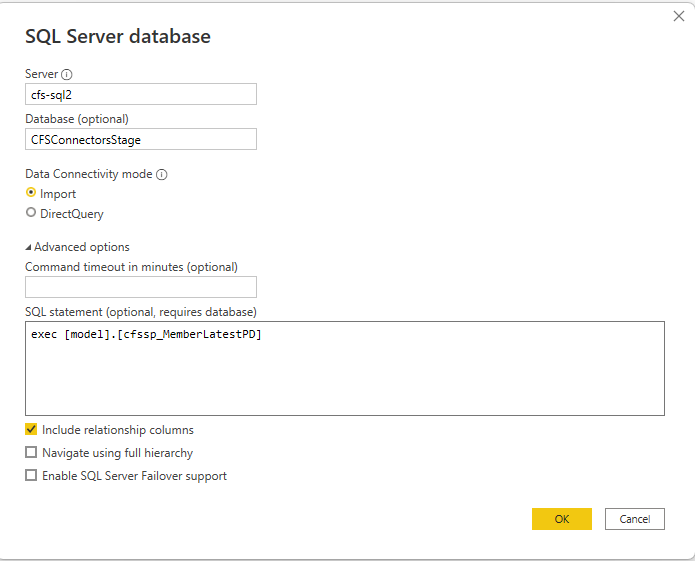
There are many ways to create a semantic layer. You can create your own tables, use table value functions, or stored procedures. We generally use stored procedures as they offer a lot of flexibility. Using a stored procedure, you can create one version of your members with all the columns that you will need over and over again. In Power BI, instead of putting in a query, you can put in the stored procedure.
Now when you need to make a change to the logic for the member or add another column, you can update the stored procedure, and it will ripple through all of the reports that use the member data.
Because these are stored procedures, you can add all kinds of parameters to further extend the flexibility of returning the member records while still having one representation of the member record.
With this approach, you have a semantic layer that contains members, loans, shares, accounts, transactions, and the GL, and each of these is represented by a handful of stored procedures consumed in hundreds of reports. Using stored procedures as a semantic layer is best practice for Credit Unions using Power BI.